Korea Business Review

kbr-research-notes

The Era of 51% in the Capital Region: Regional Korea is Disappearing

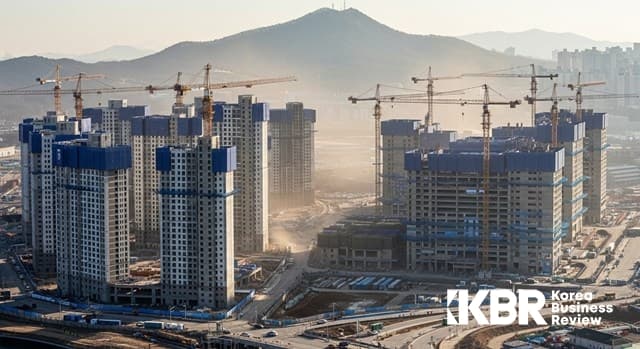
An apartment construction site in a new town in Gyeonggi Province, where dozens of cranes operate simultaneously. [Photo = Korea Business Review DB] Amid deepening population concentration in the greater Seoul metropolitan area, Gyeonggi Province is projected to be one of only two regions nationwide, along with Sejong, where the population will increase through 2052.
강지혜 기자Published 2026년 4월 16일Updated 2026년 8월 12일
Share
The Era of 51% in the Capital Region: Regional Korea is Disappearing

An apartment construction site in a new town in Gyeonggi Province, where dozens of cranes operate simultaneously. [Photo = Korea Business Review DB] Amid deepening population concentration in the greater Seoul metropolitan area, Gyeonggi Province is projected to be one of only two regions nationwide, along with Sejong, where the population will increase through 2052.


An apartment construction site in a new town in Gyeonggi Province, where dozens of cranes operate simultaneously. [Photo = Korea Business Review DB]

Amid deepening population concentration in the greater Seoul metropolitan area, Gyeonggi Province is projected to be one of only two regions nationwide, along with Sejong, where the population will increase through 2052. 


A Nation of 51.1 Million, Half Living in the Capital Area


South Korea's demographic landscape is being reorganized at an unprecedented pace. As of February 2026, the country's resident registration population stood at 51,106,229 (approximately 51.1 million), a decrease of 4,929 from the previous month (according to the Ministry of the Interior and Safety resident registration population statistics). On the surface, the nation appears to maintain a population in the 51 million range, but beneath the surface, it is fundamentally fractured.

As of February 2026, 51.07% of the total population resides exclusively in the greater Seoul metropolitan area, intensifying the concentration of population in the capital region. The population gap between the capital area and non-capital regions amounts to approximately 1.1 million (1,094,907) (based on Ministry of the Interior and Safety resident registration population statistics). This is a malformed structure where more than half of the population is concentrated in the capital region, which accounts for only about 12% of the national territory.

According to the '2025 Social Indicators of Korea' released by the National Data Agency on March 31, 2026, the total population in 2025 was tallied at 51.68 million, with the proportion of the elderly population aged 65 and older reaching 20.3%, surpassing 20% for the first time. According to United Nations standards, when the proportion of those aged 65 and older exceeds 20%, it is classified as a 'super-aged society.' South Korea has officially crossed that threshold.

According to Statistics Korea's '2025 Statistics on the Elderly,' the elderly population aged 65 and older stands at 10.514 million. The proportion of the elderly population broke through 20% just five years after standing at 15.7% in 2020, and is projected to surpass 30% in 2036 and 40% in 2050. 

Regional imbalance drastically amplifies this crisis. According to Statistics Korea's 'Future Population Projections: By Metropolitan City and Province (2022–2052),' the total population by city and province in 2052 compared to 2022 is projected to increase only in Sejong and Gyeonggi, while decreasing across all remaining 15 cities and provinces. This shows that regional extinction is not a warning of the future, but a reality foretold by official statistics.


I. Current Status of Population Migration — Dissecting the 2025 Annual Results


Lowest Number of Movers Since 1974


According to the '2025 Domestic Population Migration Statistics Results' released by the National Data Agency on January 29, 2026, the number of domestic population movers in 2025 was 6.118 million, a 2.6% (166,000) decrease from the previous year. This is the lowest level since 1974. Coming after half a century, this lowest figure carries significant implications.

The population migration rate refers to the number of movers per 100 people, standing at 12.0% as of 2025, a 0.3 percentage point decrease from the previous year. Migration rates by age group were highest in their 20s (24.3%), 30s (20.4%), and under 10 (12.9%), in that order. Compared to the previous year, only the migration rate for those in their 20s increased, while other age groups decreased or remained similar. 

The primary cause of the decline in movers is the reduction in housing-related migration. Looking at reasons for moving, the number of movers due to housing reasons saw the largest decline, down 105,000 from the previous year. The main reasons for moving in 2025 were housing (33.7%), family (25.9%), and occupation (21.4%), in that order. A structure has formed where the cooling of the real estate market suppresses population migration itself.

6 Net-Inflow vs. 11 Net-Outflow Regions


Examining the net migration rates by city and province for 2025, 6 cities and provinces including Incheon and North Chungcheong experienced a net population influx as inbound movers exceeded outbound movers, while 11 cities and provinces including Gwangju and Jeju experienced a net population outflow as outbound movers exceeded inbound. 

In the 2025 annual net migration, Incheon and North Chungcheong recorded high net-inflow rates, while Gwangju and Jeju recorded high net-outflow rates. By region, the capital area and the central region recorded net inflows, while the Yeongnam and Honam regions recorded net outflows. 

A particularly noteworthy change is Sejong's reversal of direction. Sejong shifted from net influx to net outflow, while Daejeon and South Jeolla shifted from net outflow to net influx. This signals that Sejong, having passed the peak of the administrative capital relocation effect, has now entered a phase of exporting population.


II. The Capital Region — The Expanding Republic


The Historical Turning Point of 2020


With the capital region's population surpassing that of non-capital regions for the first time starting in 2020, concentration in the capital area and regional disparities are deepening. This reversal is not a mere numerical change, but signifies a fundamental transformation in the spatial structure of Korean society.

Metropolitan autonomous entities experiencing population growth in the 2020s are limited to Gyeonggi Province, Incheon Metropolitan City, Sejong Special Self-Governing City, South Chungcheong Province, North Chungcheong Province, and Daejeon Metropolitan City. Furthermore, both the population migrating from the declining Seoul to other regions and those migrating from non-capital areas continue to gather almost exclusively in Incheon and Gyeonggi Province. 

Seoul: The Paradox of Population Outflow


Seoul occupies the most complex position in this picture. Based on resident registration population, it is continuously decreasing, yet a paradox emerges where the actual living-zone population is expanding.

Seoul's population has been declining since peaking in 2009, recording 9.39 million as of 2024. This is the combined result of low birth rates and net domestic migration outflows. 

Throughout 2025, Seoul experienced sustained monthly net outflows. As of September 2025, Seoul recorded a net outflow of -3,382, which expanded to -5,504 in November. 

Even when leaving Seoul, most people move to the adjacent Gyeongin (Seoul-Incheon-Gyeonggi) area, maintaining a strong tendency to remain within Seoul's living sphere, solidifying a structure where people do not venture outside the capital region. 

Polarization Within Gyeonggi Province


Gyeonggi Province is 'two worlds under one roof.' Cities like Hwaseong, Pyeongtaek, and Paju are enjoying their prime years with sustained population growth driven by new town developments, whereas Seongnam, Bucheon, and Ansan are experiencing stagnation or decline.

Seongnam and Bucheon are in a continuous decline as their cities are already saturated and 1st-generation new towns have aged, driving populations out to neighboring areas. Ansan, which hosts industrial complexes, is in a state of population decline or stagnation due to manufacturing slumps and migration to neighboring areas like Hwaseong. 

The population density of the capital region stood at 2,215 people/㎢ as of 2024, an increase of 9 people/㎢ from the previous year and up 91 people/㎢ compared to 2014. This means accumulation continues even at a density nearing saturation.


III. Two Paths for Non-Capital Regions — Chungcheong Holds Ground, Yeongnam and Honam Face Crisis


Chungcheong Region: The Last Buffer Zone


Regions maintaining or increasing their population outside the capital area are concentrated in the Chungcheong region. As of March 31, 2026, the metropolitan autonomous entities outside the capital area that saw population growth were Daejeon Metropolitan City, North Chungcheong Province, South Chungcheong Province, and Gangwon Special Self-Governing Province—all located immediately adjacent to the capital region in the Chungcheong and Gangwon belts. Even so, these fail to match the population growth momentum of Incheon and Gyeonggi Province, while other regions continue on a population decline trajectory. 

The population growth in these areas is structured upon proximity to the capital region. The core driver is the 'capital region spillover' effect, where populations pushed out of the capital area are absorbed into the Chungcheong region. In monthly net migration as of October 2025, net inflows were high in the order of Incheon (2,512 people), Gyeonggi (2,495 people), and North Chungcheong (847 people), demonstrating that the Chungcheong region functions as the secondary population absorption zone after the capital area. 

However, cracks are forming in this structure as well. According to Statistics Korea's Future Population Projections (Metropolitan/Provincial: 2022–2052), population decline is projected to begin in North Chungcheong in 2035, Gangwon in 2037, Incheon in 2038, and Gyeonggi and South Chungcheong in 2039. After 2039, populations are projected to decline in all 16 cities and provinces excluding Sejong. 

Yeongnam Region: Decline of Industrial Cities


Busan's population has declined since peaking in 1995, recording 3.26 million as of 2024, while Daegu's has declined since peaking in 2011 to 2.35 million. This is because Seoul and Busan suffer from low birth rates and net domestic migration outflows, while Daegu continues to experience net domestic migration outflows. 

According to Statistics Korea's future population projections, between 2022 and 2052, Busan is projected to decrease by -850,000 (-25.8%), Daegu by -580,000 (-24.3%), and Gyeongnam by -690,000 (-21.0%), showing that the scale of decline in Yeongnam's major cities is the largest nationwide. 

The regions with the highest rate of decline in the working-age population (ages 15–64) from 2022 to 2052 are Ulsan (-49.9%) and Gyeongnam (-47.8%), shocking figures indicating that half of the productive population will vanish 30 years from now. 

Honam Region: Even Gwangju is Shaking


As of October 2025, Gwangju recorded a net outflow of -1,051 people. In November, Busan (-1,152 people) and Gwangju (-1,148 people) together formed the top tier of net outflows, as the situation where even Honam's hub city, Gwangju, fails to protect its population continues. 

The proportion of the elderly population aged 65 and older in 2052 is projected to be highest in South Jeolla (49.6%), North Gyeongsang (49.4%), and Gyeongnam (47.8%), making the scenario where half of the populations in the Yeongnam and Honam regions become elderly a reality within 30 years. 


IV. Quantifying Regional Extinction — Alarm Bells in 229 Basic Local Governments


138 Extinction-Risk Areas: 6 Out of 10 Regions at Risk


As of March 2026, among 229 basic local governments, 138 are extinction-risk areas, accounting for 60.2% (based on the Korea Employment Information Service extinction risk index). This means that 6 out of every 10 basic local governments nationwide have entered the extinction-risk zone.

The extinction risk index is calculated as '(female population aged 20–39) ÷ (population aged 65 and older).' If it falls below 0.5, it is classified as an extinction-risk area. Currently, among the total population, the female population aged 20–39 is 5,882,899, and the population aged 65 and older is 11,035,092, placing South Korea's extinction risk index at 0.533, which falls into the caution stage. 

Individual cases are even more shocking. As of October 2025, the basic local government with the lowest extinction risk index was approximately 0.075, dropping below 0.08 for the first time among basic local governments, and regions entering high-risk extinction areas among city-level basic local governments have also emerged. 

89 Population-Decline Regions: The Executive Branch's Official Crisis Declaration


The Ministry of the Interior and Safety has designated 89 cities, counties, and districts as population-decline regions, while separately designating and managing 18 regions of interest, including Dong-gu in Daejeon, Dong-gu in Incheon, Jung-gu in Busan, Geumjeong-gu in Busan, Dong-gu in Gwangju, Tongyeong in South Gyeongnam, and Gangneung in Gangwon. Designations for population-decline regions are made on a 5-year cycle, with the initial designation made in October 2021. 

The designation criteria for population-decline regions are based on a population decline index combining 8 indicators: average annual population growth rate, population density, youth net migration rate, daytime population, aging ratio, youth-to-elderly ratio, crude birth rate, and financial independence. The Regional Extinction Response Fund is intensively injected into designated regions.


V. Structural Changes in Migration Motives — From 'Family' to 'Job'


The reasons for population migration itself are changing. Based on an analysis of moving-in reports, migration for family reasons (33.4%) was the most common in 2014, whereas migration for job reasons (29.4%) was the highest in 2025. Compared to 10 years ago, the proportion of moves for family and housing reasons has decreased, while the proportion of moves for jobs, education, and residential environments has increased. 

By annual moving-in reasons for 2025, housing (33.7%), family (25.9%), and occupation (21.4%) followed in order. Among moving-in reasons, the number of movers due to housing saw the largest decrease, down 105,000 from the previous year (based on National Data Agency 2025 domestic population migration statistics). 

The patterns of youth migration have also changed structurally. Youths in their 20s are active in long-distance inter-provincial migration, and the inter-provincial migration rate of youths aged 20–24 has increased sharply compared to 10 years ago. The report analyzed that this is due to life-cycle characteristics prompting movement to universities and workplaces located in the capital region. 

This shift in migration motives is also changing the direction of regional population policies. The report suggested that to increase regional populations, policies focused on promoting population influx and preventing outflow are more effective than total fertility rate enhancement policies. It emphasized that to mitigate youth outflow to the capital area, it is important to make large-scale infrastructure investments in specialized fields for each hub city and strengthen social networks. 

Meanwhile, faint reversal signals are appearing in some extinction-risk areas. Despite youth outflows, areas like Ganghwa-gun (3,157 people), Gapyeong-gun (2,258 people), and Yeongcheon-si (2,911 people), which have experienced steady inflows of middle-aged and older adults over the past 5 years, are being chosen as new settlement destinations for middle-aged residents who can simultaneously enjoy urban convenience and rural leisure. However, this level of middle-aged influx is far from sufficient to offset youth outflow and natural population decline.


VI. Structural Causes — Population Imbalance Created by Productivity Disparities


KDI: Economic Mechanism of Capital Region Concentration


In a report titled 'KDI FOCUS — Why Does Concentration in the Capital Region Continue?' released in January 2026, the Korea Development Institute (KDI) analyzed that the reinforcement of the capital region's productivity superiority drove the deepening concentration in the capital area from 2005 to 2019. It is estimated that if the productivity of non-capital manufacturing cities had risen to the national average, the capital region's population share would have dropped by 6.5 percentage points, decreasing by about 2.6 million people. 

The analysis showed that productivity in each hub city needs to rise by an average of 8.2% for the capital region's share to fall to the 46% level. This implies that this is a structural challenge that cannot be resolved through simple relocation subsidy policies. 

KDI suggested that rather than creating new towns on empty land, implementing intensive investments focused on boosting the productivity of existing major cities has a relatively high probability of success, and reorganizing non-capital regions around major cities is effective in easing concentration in the capital area. 


VII. Future Outlook — Warnings for 2052 and 2072


According to Statistics Korea's 'Future Population Projections: By Metropolitan City and Province (2022–2052),' South Korea's total population is projected to decrease by 10.5% from 51.67 million in 2022 to 46.27 million in 2052, with only Sejong (+41.1%) and Gyeonggi (+0.9%) increasing while populations in all remaining 15 cities and provinces decline.

According to the National Data Agency's '2025 Social Indicators of Korea,' the total population in 2072 is projected to be 36.22 million, and the proportion of the population aged 65 and older is predicted to surge from 20.3% in 2025 to 47.7% in 2072. 

The speed of aging by region is even more extreme. The proportion of the elderly population aged 65 and older in 2052 is projected to be highest in South Jeolla (49.6%), North Gyeongsang (49.4%), and Gyeongnam (47.8%). By 2052, the old-age dependency ratio is expected to exceed 100 people in 4 cities and provinces, including South Jeolla, North Gyeongsang, Gyeongnam, and Gangwon. In other words, a structure where 1 working-age person must support 1 or more elderly persons will become a reality. 

The year 2039 marks another turning point. After 2039, population decline is projected to begin in 16 cities and provinces excluding Sejong, and from 2045, all cities and provinces are projected to experience natural population decline (number of births < number of deaths). 


Conclusion: Is a 'Nation Where Everywhere is Good to Live' Possible?


South Korea's demographic landscape right now is not simply a matter of population decline. A vicious cycle is solidifying where disparities in productivity, jobs, medical care, and education between the capital region and non-capital regions force population migration, and that migration in turn weakens the local economic, administrative, and medical foundations.

Considering the proportion of extinction-risk areas and future population projections, the reality that 60.2% of the 229 basic local governments are classified as extinction-risk areas means we have already moved past the warning level and entered the early stage of structural collapse.

The government has put forward the vision of 'an era of local regions where anywhere in South Korea is good to live,' announcing plans to inject 1 trillion won annually for 10 years into the Regional Extinction Response Fund. However, the 2005 domestic population migration statistics coldly show that policies have yet to create a tangible reversal, recording the lowest number of movers since 1974 along with sustained net outflows from the Yeongnam and Honam regions.

Population statistics are ultimately the cumulative result of people's choices. To change the direction of those choices, the quality of life in those regions itself must change. These figures right now are telling us most honestly where our society is heading.


KBR Access

KBR Analysis 콘텐츠는 Premium 전용 콘텐츠입니다

이 콘텐츠는 Premium 회원에게 제공되는 프리미엄 콘텐츠입니다. Premium은 1개월 이용권 34,900원 또는 월 정기결제 29,900원이며, 결제 시 1개월 이용권(1회 결제·자동갱신 없음) 또는 월 정기결제(매월 자동결제)를 선택할 수 있습니다. ESG, KBR 아티클, KBR Analysis 등 핵심 프리미엄 콘텐츠를 열람할 수 있습니다.

이번 달 열람 현황: 0 / 0건 사용