


New businesses demand investment on the grounds that the market is expanding, while existing businesses try to protect their budgets because they are currently generating revenue. The BCG Matrix is a tool that organizes this debate around two axes—market growth rate and relative market share—while factoring in actual cash flows, competitiveness, and inter-business connections for final investment decisions. The core of its application lies not in labeling the four quadrants, but in accurately defining the market to be compared and creating conditions to allocate more funds to or reduce funds from each business.
Two Questions to Understand Before the Four Types
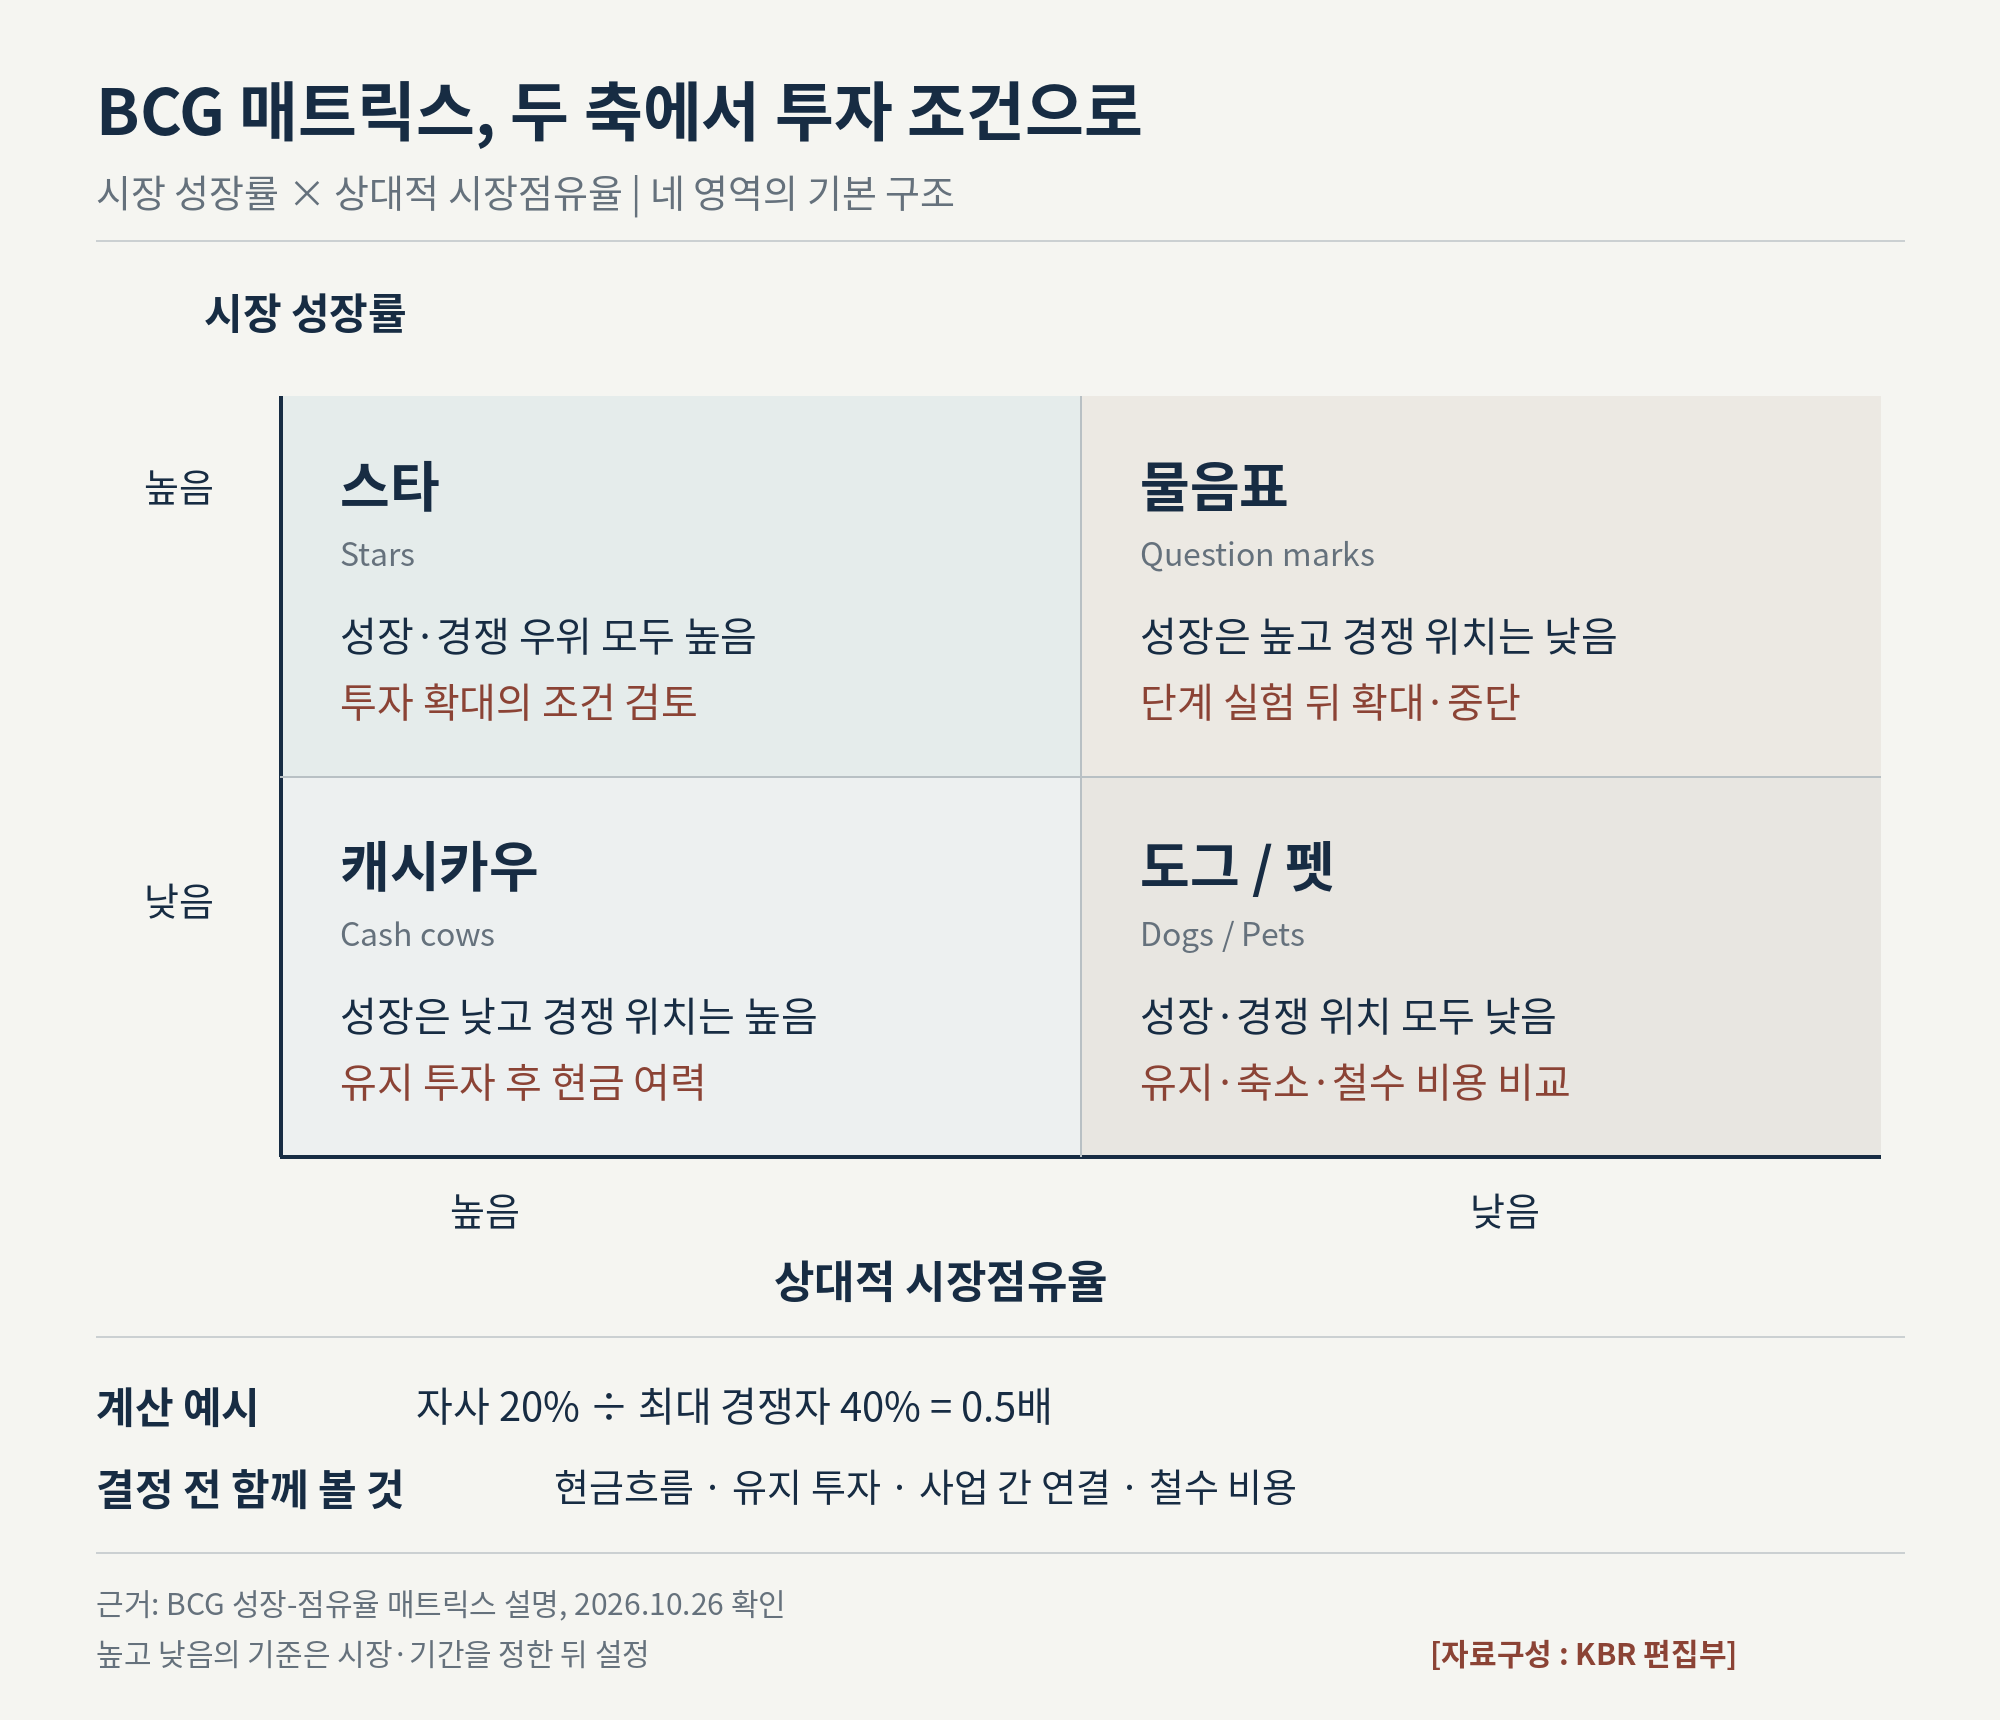
The growth-share matrix described by BCG is a framework for reviewing the resource allocation priorities of multiple businesses. The vertical axis shows how much the relevant market is growing, and the horizontal axis shows the company's position in that market relative to key competitors. Therefore, classifying a business as having high growth potential simply because sales increased, or judging its competitiveness to be strong simply because its revenue constitutes a large share within the company, means answering a different question from the start.
The four regions are called Stars, Cash Cows, Question Marks, and Dogs. Stars are businesses with both high market growth rates and high relative market share, while Cash Cows are businesses with low market growth but high relative market share. Question Marks are cases where the market is growing rapidly but relative market share is low, and Dogs correspond to cases where both indicators are low. In BCG's current introductions, the final area is also referred to as Pets.
This classification embodies the mindset that growth businesses require capital, and mature businesses with competitive advantages can support other opportunities. However, the names of the quadrants do not replace an income statement or cash flow statement. Businesses with high market shares may suffer from cash shortages due to discount competition and capital expenditures, and niche businesses with low growth rates may be worth maintaining thanks to customers' high willingness to pay and low operational burdens.
The First Step Is the Boundary of the Market, Not the List of Businesses
When starting an analysis, it is better to examine what customers substitute and purchase from one another rather than taking business unit names as they are. Even within the same company's education business, customized corporate training and individual online subscriptions may have different customers, purchasing procedures, and competitors. Combining these into one masks the opportunities in growing areas and the burdens of shrinking areas within averages.
The market definition specifies the scope of products or services, customer groups, regions, sales channels, and time periods. When calculating the market share of a specific service provided to domestic corporate clients while including global related industry revenue in the denominator, the competitive position may be underestimated. Conversely, if the market is overly narrowed by selecting only customers and regions favorable to the company, anyone can look like a market leader; thus, boundaries must be explained based on customers' actual substitute purchases and competitors' bidding participation scopes.
When market boundaries are ambiguous, results can be compared across broad and narrow scopes rather than fixing a single number. If the investment direction is the same under both definitions, the reliability of the judgment is high, but if shifting the boundary slightly turns a Star into a Question Mark, further investigation into the market definition must come first. What is needed at this point is not a more elaborately crafted chart, but an agreement on which customers' purchases are being competed for.
How to Calculate Relative Market Share and Market Growth Rate
Relative market share can be calculated by dividing a company's market share by the market share of the largest competitor excluding the company itself. If the company is the market leader, the comparison target is the next largest competitor, and 1.0x means the market shares of both businesses are equal. This value differs from general market share, which indicates the company's proportion of the total market; therefore, reports should clearly distinguish between percentages and multiples.
For example, assuming a company's market share in the same market is 20% and the largest competitor's is 40%, the relative market share is 0.5x. If the company's market share is 30% and the largest competitor's is 20%, it becomes 1.5x. The former means that even if the company's sales are the largest within the firm, its scale is smaller than that competitor, while the latter shows an advantage in the comparison market. In neither case does this calculation alone reveal operating profit margins or return on investment.
The market growth rate on the vertical axis is calculated by dividing the current period's market size of the same scope by the previous period's market size, subtracting 1, and multiplying by 100. The target is the change in the entire market, not the company's sales, and the basis—whether quantity-based or value-based—must also be consistent. In markets where selling prices have risen, increases in sales revenue and sales volume may diverge, and when combining data in different currencies, exchange rate fluctuations may look like growth.
Whether to choose sales volume or sales revenue must also be determined according to the business's competitive approach. In markets where low-priced and high-priced products coexist, quantity share and value share may show different aspects. Rather than changing indicators depending on which side is more advantageous to the company, one must determine the objective—whether to observe scale competition or the ability to secure customer spending—and maintain the same criteria to enable comparison.
The line separating high and low growth rates should be determined before looking at the data, and it is more rational to leave the reasons for the selection. Applying the same growth rate mechanically to all industries can cause one to miss promising businesses within mature markets and temporarily overheated markets. While reviewing both the most recent year's performance and multi-year trends, it is basic practice not to mix performance data and future forecasts indiscriminately in a single table.
Looking at 2026 Electric Vehicle Data Changes the Meaning of Numbers
According to the Global EV Outlook 2026 published by the International Energy Agency on May 20, 2026, global electric vehicle sales in 2025 increased by 20% from the previous year, surpassing 20 million units and accounting for 25% of total new car sales. Electric vehicles in this data include battery electric vehicles and plug-in hybrids. Since 20% is the growth rate of the EV sales market and 25% is the sales share occupied by EVs in the total new car market, these figures are derived from different denominators.
These two numbers alone do not allow a specific automotive company's EV business to be called a Star. That judgment additionally requires data on how much that company and its largest competitor sold respectively within the same region and vehicle class scope. Replacing the market penetration rate of the product group called electric vehicles with a specific company's relative share confuses the fact that the market is promising with the claim that the company is ahead in the competition.
Dividing by region also changes judgments regarding market growth. The same report explains that while Southeast Asian EV sales more than doubled in 2025, U.S. annual sales largely stagnated. It is difficult to fully explain different investment tasks by applying a single global average growth rate to a business reviewing market entry in Southeast Asia and a business maintaining existing customers in the U.S.
Furthermore, the report's projections for 2026 global EV sales of 23 million units and a total new car sales share of 28% are forecasts at the time of publication. These should not be written as confirmed annual performances or treated with the same certainty as 2025 performance. In actual application, the appropriate method is to map confirmed past positions first, mark future positions according to forecasts separately, and connect which assumptions change to revise investment judgments.
How to Turn the Four Quadrants into Budget and Execution Conditions
For businesses classified as Stars, investments to keep pace with market growth can be distinguished from investments to expand competitive advantage. The former serves to maintain supply capacity or service quality, while the latter is a choice expecting additional performance, such as new products or channel expansion. Approving both expenditures lumped together as growth investments makes it difficult to judge what should be cut when performance falls short.
In Cash Cows, it is important to calculate first how much remains after maintaining competitiveness, rather than how much can be sent to other businesses. Excessively cutting facility maintenance, core talent, customer retention, and operating capital can weaken the current cash generation base. Looking at cash expenditures required to sustain the business and collection timing together, instead of simple sales volume or accounting profit, reveals the scope of resources that can actually be mobilized.
Question Marks require phased choices between full expansion and immediate withdrawal. For example, when reviewing a new education subscription service, experiments solely to increase initial subscriber numbers differ in purpose from experiments to verify repeat purchases by paid users. Depending on whether acquired customers translate into revenue that can cover costs and how operating burdens change as customer numbers increase, the scale of the next phase of investment can be determined.
Businesses classified as Dogs must also weigh the scale of losses, exit costs, and impacts on other businesses. Even if standalone profits are low, the service may be necessary to maintain contracts with core clients, and separating facilities shared with other businesses could increase costs for the remaining businesses. Conversely, if explanations of strategic relevance are repeated without presenting costs and effects, it can serve as a basis for continuously postponing maintenance decisions.
Accordingly, setting different approval conditions rather than applying the same budget growth rate to each type fits the purpose of application. Stars review the maintenance of competitive advantage following additional investment, Cash Cows review cash capacity after maintenance investment, Question Marks review customer response to justify subsequent investments, and Dogs review total costs for maintenance, reduction, or disposal. The core of decision-making is how the change in classification creates actual differences in the allocation of funds and people, rather than the fact that the classification has changed.
Meeting Materials Should Include Positions and the Rationale to Change Judgments
Working-level materials can include market definition, data baseline dates, sales and cash contributions, next actions, and review conditions line by line, in addition to business names and values for the two axes. If business scale is indicated by circle size, whether the metric represents revenue, profit, or investment amount must be determined beforehand and applied uniformly across all businesses. It is also important to clarify legends so that large revenue circles are not misinterpreted as highly profitable businesses.
If share data is unavailable, it is better to limit judgment by distinguishing secured information from missing information rather than entering internal estimates as facts. For example, even when competitor revenues are known but total market size is missing, there is still room to compare competing revenues of the same scope; however, simply dividing consolidated revenues containing different products and regions cannot be regarded as relative share. The scope and aggregation method matching take precedence over the name of the data.
When reflecting inter-business connections, it is also important not to double-count effects. Adding customer revenues obtained through joint sales to the contributions of both businesses, or interpreting an increase in one business's profit resulting from a change in headquarters common cost allocation methods as an improvement in competitiveness, obscures the rationale for resource allocation. Separating the additional effects generated when operating alongside independent business cash makes it possible to more clearly compare costs that actually disappear and costs that remain after disposal or downsizing.
In review meetings, it is more productive to agree on evidence that would change investment conclusions rather than arguing over which quadrant business heads want to move into. Deciding which executions to suspend when customer retention falls lower than expected or the profitability of new contracts fails to improve can prevent subsequent meetings from devolving into repeated explanations. Conversely, conditions to allocate additional resources when opportunities grow due to competitor withdrawals or improved contract terms should also be left open.
Investment periods cannot be identical across businesses either. Comparing a business that requires upfront facility construction with a service business that deploys personnel after securing contracts based solely on this quarter's profits misses differences in cash recovery structures. Placing expected capital expenditures and recovery periods on the same timeline and examining whether peak funding requirements overlap with other businesses allows for a simultaneous judgment of individual business attractiveness and overall corporate capacity.
Review intervals can be tailored to the speed of market changes and the irreversibility of investment decisions. Binding highly volatile new businesses solely to annual plans can delay responses, but altering business direction with every minor monthly fluctuation destroys execution consistency. Distinguishing between scheduled periodic reviews and reviews triggered by significant condition changes enables organizations to adhere to plans while reacting to new evidence.
Using the Classification Table as a Conversation Tool for Resource Allocation, Not as a Chart
In a 2014 article re-examining this tool, BCG emphasized that market share is difficult to serve as a direct predictor of sustained performance and highlighted the need for rapid, economical experimentation. This means that rather than applying old frameworks as they are, one should read them by supplementing the actual business competitiveness and cash generation structure. There is no need to discard them simply because they are old frameworks, nor can judgment be entrusted to them simply because they are familiar quadrants.
The output of properly utilizing the BCG Matrix does not end with a single sheet of paper classifying all businesses without omission. The market in which one competes, the current position, the resources required to maintain or change that position, and the evidence that would modify decisions must all be connected. Only then does the budget debate between growth businesses and mature businesses transform into concrete choices comparing past performance with future expectations.